Measured results
Cost is a property of the engine, not of the language. The rules in
docs/ARCHITECTURE.md constrain what a file may say and would survive an engine
swap untouched; what a build costs is settled here, by measurement. That
separation is why this file can be rewritten by a benchmark run without
anything in docs/SPEC.md moving.
Peak RSS and wall time for the same model built two ways — declaratively on the
relational engine, and eagerly through linopy — from the same parquet files to
the same destination. wall and peak columns are lpspec ÷ linopy: below
1.00 is a win for us. The chart page plots the same
run.
The eager arm is lpspec.linopy.build, not hand-written linopy — our own
YAML→linopy.Model shim, so it carries our loader on top of linopy's work.
Against hand-written linopy on the same model the shim costs a constant
~2.3 ms: a fixed offset, nowhere near enough to move a conclusion.
Two sinks, and they are not the same comparison. The LP file is the artifact
fewest callers want; highs is the one most reach for, and there HiGHS's own
dense model is resident in both arms, which narrows every ratio. Read the sink
you actually use.
How to reproduce it
Read straight off latest.json and
density.jsonl, each carrying the machine
fingerprint, the library versions and the commit that produced it. Two files
because a run replaces its output: one narrower than the tables it publishes
would leave them unprovenanced while still looking complete.
uv run pytest bench --benchmark-memory --sizes xs s m l \
    --benchmark-json=bench/results/latest.json
uv run pytest bench --benchmark-memory --sizes d100 d50 d25 d08 --skip-gate \
    --benchmark-json=bench/results/density.json

uv run python -m bench.report bench/results/latest.json bench/results/density.json
uv run python -m bench.plot  # the figures above, and the chart page's numbers
The results committed today are the .jsonl the runner before
#448 wrote; both readers take
either, so the figures regenerate against the tree as it stands rather than
only after the next full ladder.
Measure on an idle machine. An earlier version of these tables was taken
while the laptop was doing other work and it inflated profiled by 55% —
enough to turn "level" into "the one case we lose". Best of three, nothing else
running.
Measured at f10c3ee, on a clean tree. Each results file's fingerprint
carries the hash and the dirty flag, so a number here can be traced to the code
that produced it — which is the whole point of committing the files. density
and scaling are older files, at 98f382d, and say so.
Darwin 25.2.0, python 3.13.2, 26 GB · lpspec 0.0.1a61 · polars 1.43.1 · linopy
0.8.0.post1.dev140+g346943317 (the v1-semantics build, PyPSA/linopy#717) ·
highspy 1.15.1 · gurobipy 13.0.2 · scipy 1.18.0 · numpy 2.5.1. Nine rounds per
measurement; the report takes the minimum. Parity gate: all six cases
agree to 0.0e+00 relative (fleet to 4.6e-16) before anything is timed.
Peak is measured cold. pytest-benchmem 0.5 dropped the warmup from the
isolated pass, so a peak here is the first call in a fresh process — which is
what this page describes and what a caller building one model pays. Peaks taken
under 0.4 are a different quantity wearing the same name, and are not mixed in.
This lane replaced a duckdb engine, and the three-way comparison that decided it — speed against a settable memory ceiling — is in #189 and in git. It is not re-measured here: duckdb is no longer a dependency, and a column nobody can re-run is a claim with a shelf life.
Results
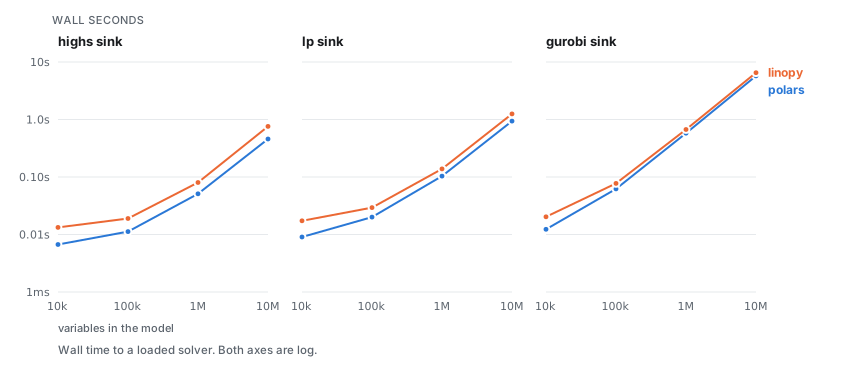
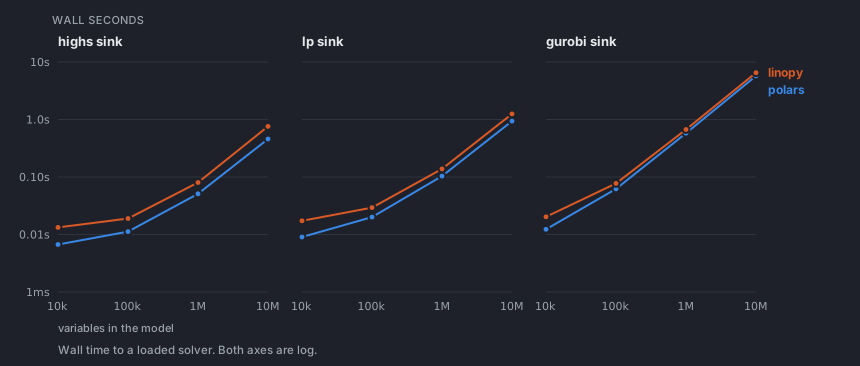
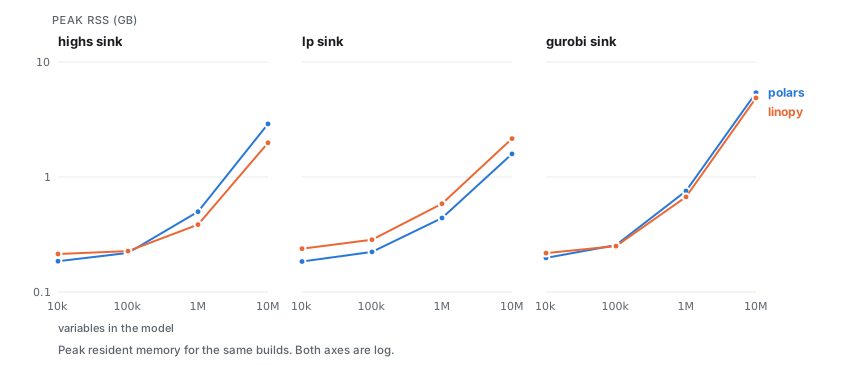
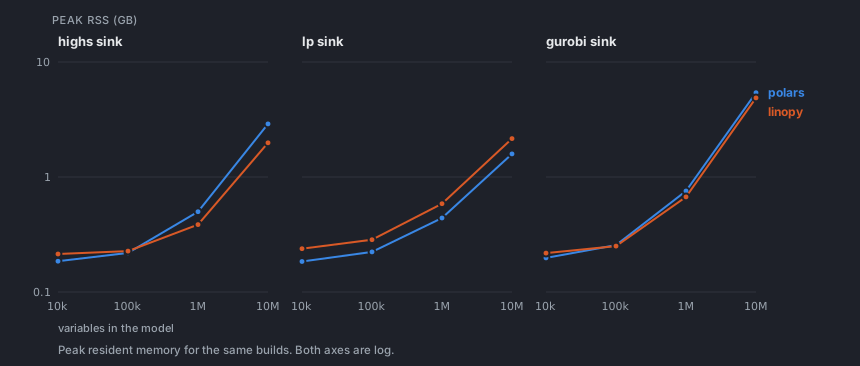
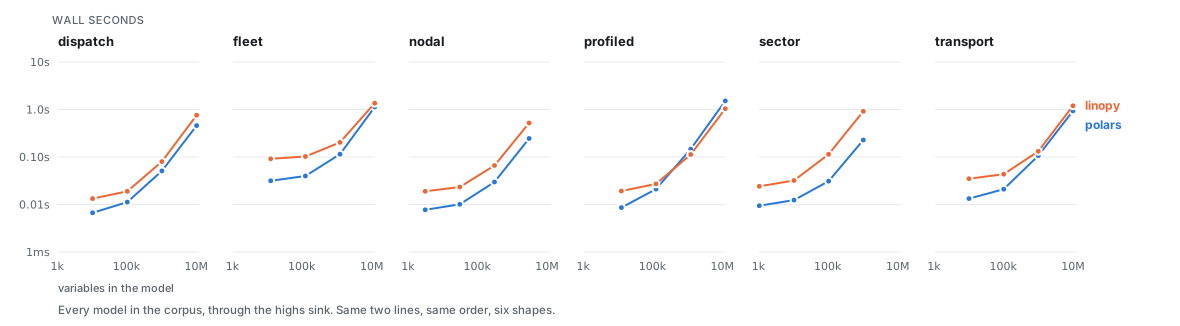
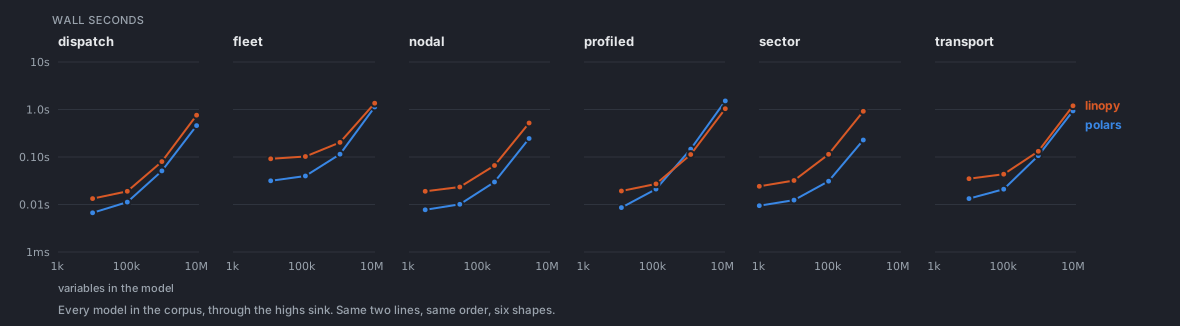
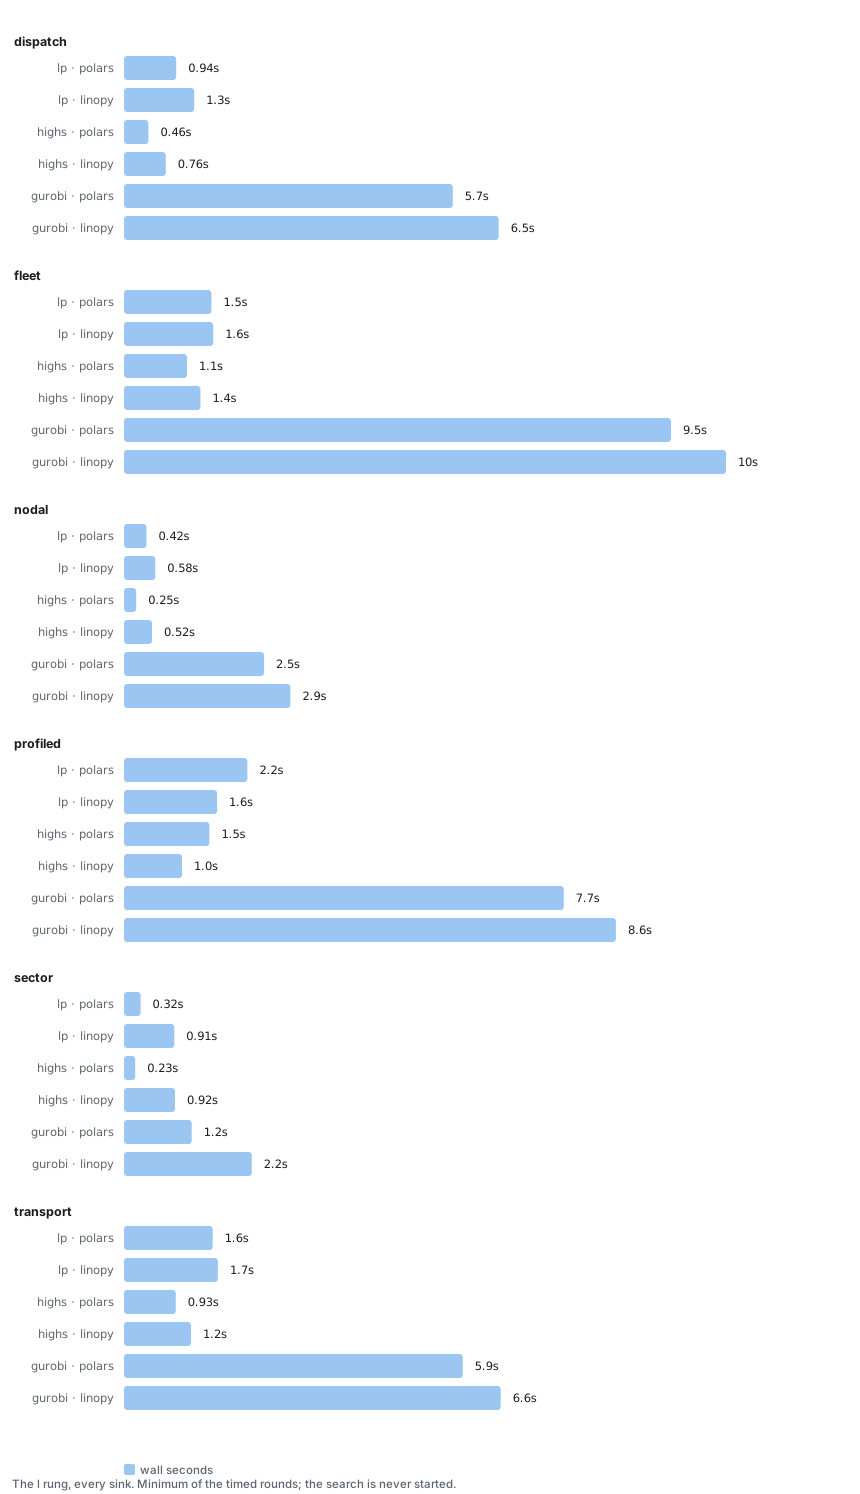
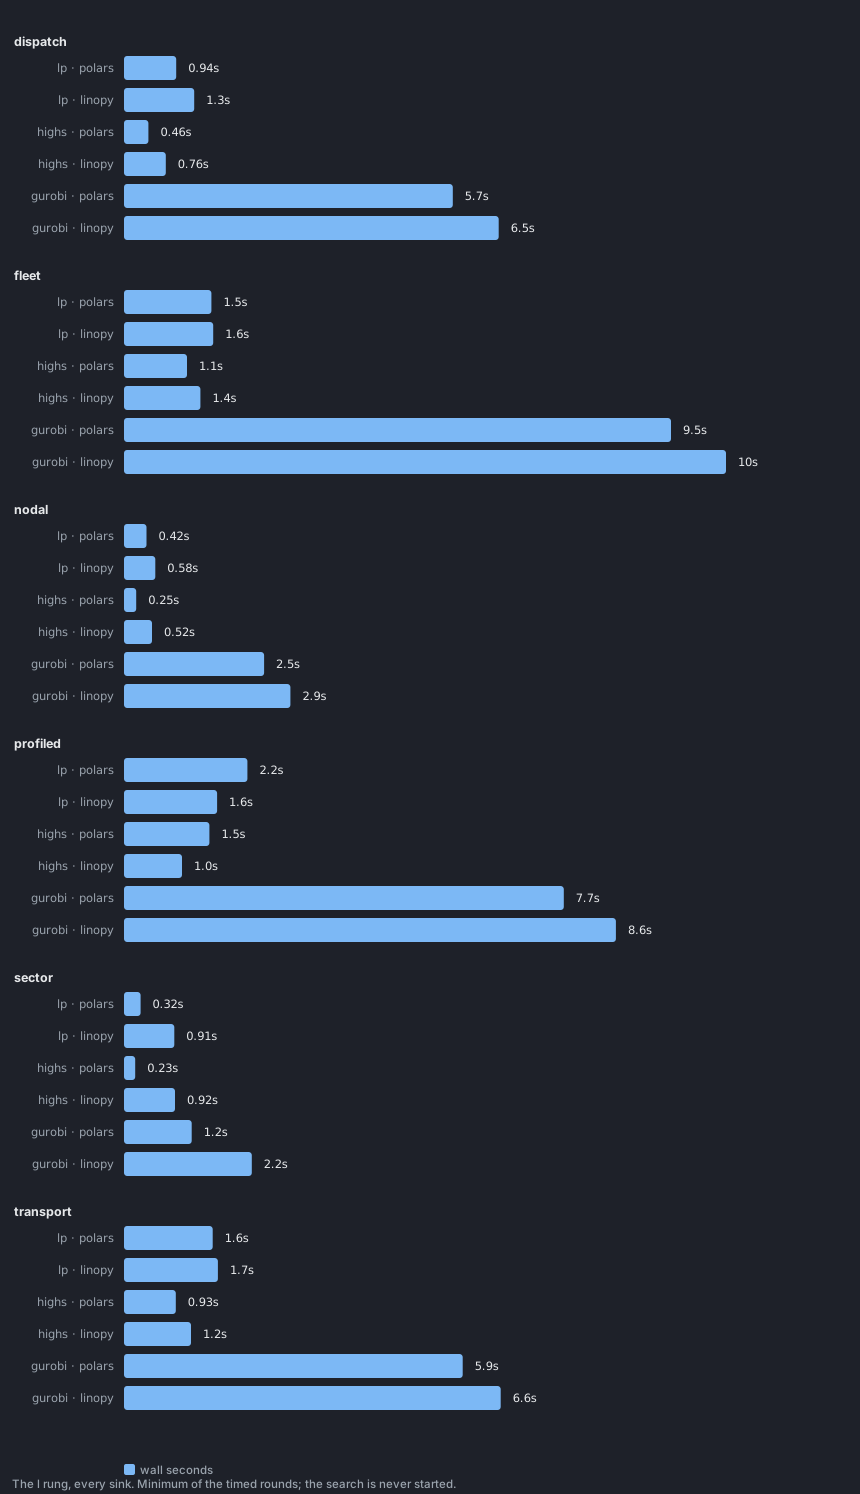
Static, so they render anywhere. The same data with a cursor: the chart page.
dispatch — every rung, every sink
dispatch — gurobi sink
Both arms end holding a populated gurobipy.Model with optimize() never called: lpspec through build_gurobi, linopy through to_gurobipy(set_names=False). Opt-in — it needs the [gurobi] extra — and the same discipline as the highs sink.
| variables | live | rows | wall: lpspec | wall: linopy | wall | peak: lpspec | peak: linopy | peak | LP |
|---|---|---|---|---|---|---|---|---|---|
| 10k | 100% | 100 | 0.01 s | 0.02 s | 0.61x | 0.20 GB | 0.22 GB | 0.91x | — |
| 100k | 100% | 1k | 0.06 s | 0.08 s | 0.80x | 0.26 GB | 0.25 GB | 1.02x | — |
| 1M | 100% | 10k | 0.58 s | 0.67 s | 0.86x | 0.76 GB | 0.67 GB | 1.13x | — |
| 10M | 100% | 100k | 5.73 s | 6.53 s | 0.88x | 5.41 GB | 4.88 GB | 1.11x | — |
dispatch — highs sink
Both arms end holding a populated highspy.Highs with run() never called: lpspec through build_highs, linopy through to_highspy(set_names=False). The simplex is the same work whoever filled the model, so timing it would say nothing about the lane that filled it.
| variables | live | rows | wall: lpspec | wall: linopy | wall | peak: lpspec | peak: linopy | peak | LP |
|---|---|---|---|---|---|---|---|---|---|
| 10k | 100% | 100 | 0.01 s | 0.01 s | 0.50x | 0.19 GB | 0.21 GB | 0.87x | — |
| 100k | 100% | 1k | 0.01 s | 0.02 s | 0.59x | 0.22 GB | 0.23 GB | 0.96x | — |
| 1M | 100% | 10k | 0.05 s | 0.08 s | 0.64x | 0.50 GB | 0.39 GB | 1.30x | — |
| 10M | 100% | 100k | 0.46 s | 0.76 s | 0.60x | 2.89 GB | 1.98 GB | 1.46x | — |
dispatch — lp sink
lpspec writes the LP file, linopy through its lp-polars writer.
| variables | live | rows | wall: lpspec | wall: linopy | wall | peak: lpspec | peak: linopy | peak | LP |
|---|---|---|---|---|---|---|---|---|---|
| 10k | 100% | 100 | 0.01 s | 0.02 s | 0.52x | 0.18 GB | 0.24 GB | 0.77x | — |
| 100k | 100% | 1k | 0.02 s | 0.03 s | 0.68x | 0.22 GB | 0.28 GB | 0.78x | — |
| 1M | 100% | 10k | 0.10 s | 0.14 s | 0.75x | 0.44 GB | 0.59 GB | 0.75x | — |
| 10M | 100% | 100k | 0.94 s | 1.25 s | 0.75x | 1.59 GB | 2.16 GB | 0.74x | — |
fleet — every rung, every sink
fleet — gurobi sink
Both arms end holding a populated gurobipy.Model with optimize() never called: lpspec through build_gurobi, linopy through to_gurobipy(set_names=False). Opt-in — it needs the [gurobi] extra — and the same discipline as the highs sink.
| variables | live | rows | wall: lpspec | wall: linopy | wall | peak: lpspec | peak: linopy | peak | LP |
|---|---|---|---|---|---|---|---|---|---|
| 12k | 100% | 6.02k | 0.04 s | 0.11 s | 0.38x | 0.20 GB | 0.22 GB | 0.90x | — |
| 120k | 100% | 60.2k | 0.12 s | 0.20 s | 0.63x | 0.29 GB | 0.29 GB | 1.00x | — |
| 1.2M | 100% | 602k | 0.97 s | 1.13 s | 0.86x | 1.14 GB | 1.01 GB | 1.13x | — |
| 12M | 100% | 6.02M | 9.51 s | 10.46 s | 0.91x | 8.83 GB | 7.80 GB | 1.13x | — |
fleet — highs sink
Both arms end holding a populated highspy.Highs with run() never called: lpspec through build_highs, linopy through to_highspy(set_names=False). The simplex is the same work whoever filled the model, so timing it would say nothing about the lane that filled it.
| variables | live | rows | wall: lpspec | wall: linopy | wall | peak: lpspec | peak: linopy | peak | LP |
|---|---|---|---|---|---|---|---|---|---|
| 12k | 100% | 6.02k | 0.03 s | 0.09 s | 0.34x | 0.19 GB | 0.22 GB | 0.88x | — |
| 120k | 100% | 60.2k | 0.04 s | 0.10 s | 0.39x | 0.24 GB | 0.24 GB | 0.99x | — |
| 1.2M | 100% | 602k | 0.11 s | 0.20 s | 0.57x | 0.63 GB | 0.55 GB | 1.14x | — |
| 12M | 100% | 6.02M | 1.13 s | 1.36 s | 0.83x | 4.08 GB | 3.73 GB | 1.09x | — |
fleet — lp sink
lpspec writes the LP file, linopy through its lp-polars writer.
| variables | live | rows | wall: lpspec | wall: linopy | wall | peak: lpspec | peak: linopy | peak | LP |
|---|---|---|---|---|---|---|---|---|---|
| 12k | 100% | 6.02k | 0.03 s | 0.11 s | 0.31x | 0.19 GB | 0.24 GB | 0.79x | — |
| 120k | 100% | 60.2k | 0.05 s | 0.13 s | 0.39x | 0.26 GB | 0.27 GB | 0.94x | — |
| 1.2M | 100% | 602k | 0.18 s | 0.25 s | 0.72x | 0.65 GB | 0.47 GB | 1.39x | — |
| 12M | 100% | 6.02M | 1.55 s | 1.58 s | 0.98x | 2.36 GB | 1.63 GB | 1.45x | — |
nodal — every rung, every sink
nodal — gurobi sink
Both arms end holding a populated gurobipy.Model with optimize() never called: lpspec through build_gurobi, linopy through to_gurobipy(set_names=False). Opt-in — it needs the [gurobi] extra — and the same discipline as the highs sink.
| variables | live | rows | wall: lpspec | wall: linopy | wall | peak: lpspec | peak: linopy | peak | LP |
|---|---|---|---|---|---|---|---|---|---|
| 3k | 25% | 1k | 0.01 s | 0.02 s | 0.46x | 0.20 GB | 0.22 GB | 0.89x | — |
| 30k | 25% | 10k | 0.03 s | 0.05 s | 0.67x | 0.22 GB | 0.23 GB | 0.97x | — |
| 300k | 25% | 100k | 0.25 s | 0.30 s | 0.81x | 0.47 GB | 0.44 GB | 1.06x | — |
| 3M | 25% | 1M | 2.46 s | 2.92 s | 0.84x | 2.36 GB | 2.59 GB | 0.91x | — |
nodal — highs sink
Both arms end holding a populated highspy.Highs with run() never called: lpspec through build_highs, linopy through to_highspy(set_names=False). The simplex is the same work whoever filled the model, so timing it would say nothing about the lane that filled it.
| variables | live | rows | wall: lpspec | wall: linopy | wall | peak: lpspec | peak: linopy | peak | LP |
|---|---|---|---|---|---|---|---|---|---|
| 3k | 25% | 1k | 0.01 s | 0.02 s | 0.41x | 0.19 GB | 0.22 GB | 0.86x | — |
| 30k | 25% | 10k | 0.01 s | 0.02 s | 0.43x | 0.20 GB | 0.22 GB | 0.92x | — |
| 300k | 25% | 100k | 0.03 s | 0.07 s | 0.45x | 0.35 GB | 0.33 GB | 1.04x | — |
| 3M | 25% | 1M | 0.25 s | 0.52 s | 0.47x | 1.34 GB | 1.50 GB | 0.89x | — |
nodal — lp sink
lpspec writes the LP file, linopy through its lp-polars writer.
| variables | live | rows | wall: lpspec | wall: linopy | wall | peak: lpspec | peak: linopy | peak | LP |
|---|---|---|---|---|---|---|---|---|---|
| 3k | 25% | 1k | 0.01 s | 0.02 s | 0.41x | 0.18 GB | 0.24 GB | 0.77x | — |
| 30k | 25% | 10k | 0.01 s | 0.03 s | 0.51x | 0.21 GB | 0.26 GB | 0.78x | — |
| 300k | 25% | 100k | 0.05 s | 0.07 s | 0.71x | 0.33 GB | 0.47 GB | 0.71x | — |
| 3M | 25% | 1M | 0.42 s | 0.58 s | 0.73x | 1.06 GB | 1.56 GB | 0.68x | — |
profiled — every rung, every sink
profiled — gurobi sink
Both arms end holding a populated gurobipy.Model with optimize() never called: lpspec through build_gurobi, linopy through to_gurobipy(set_names=False). Opt-in — it needs the [gurobi] extra — and the same discipline as the highs sink.
| variables | live | rows | wall: lpspec | wall: linopy | wall | peak: lpspec | peak: linopy | peak | LP |
|---|---|---|---|---|---|---|---|---|---|
| 12k | 100% | 1k | 0.02 s | 0.03 s | 0.56x | 0.20 GB | 0.22 GB | 0.92x | — |
| 120k | 100% | 10k | 0.08 s | 0.10 s | 0.76x | 0.32 GB | 0.27 GB | 1.16x | — |
| 1.2M | 100% | 100k | 0.72 s | 0.87 s | 0.82x | 1.13 GB | 0.87 GB | 1.30x | — |
| 12M | 100% | 1M | 7.65 s | 8.56 s | 0.89x | 6.91 GB | 6.74 GB | 1.02x | — |
profiled — highs sink
Both arms end holding a populated highspy.Highs with run() never called: lpspec through build_highs, linopy through to_highspy(set_names=False). The simplex is the same work whoever filled the model, so timing it would say nothing about the lane that filled it.
| variables | live | rows | wall: lpspec | wall: linopy | wall | peak: lpspec | peak: linopy | peak | LP |
|---|---|---|---|---|---|---|---|---|---|
| 12k | 100% | 1k | 0.01 s | 0.02 s | 0.45x | 0.19 GB | 0.22 GB | 0.88x | — |
| 120k | 100% | 10k | 0.02 s | 0.03 s | 0.78x | 0.28 GB | 0.24 GB | 1.14x | — |
| 1.2M | 100% | 100k | 0.15 s | 0.11 s | 1.30x | 0.82 GB | 0.50 GB | 1.64x | — |
| 12M | 100% | 1M | 1.51 s | 1.04 s | 1.46x | 3.93 GB | 3.11 GB | 1.26x | — |
profiled — lp sink
lpspec writes the LP file, linopy through its lp-polars writer.
| variables | live | rows | wall: lpspec | wall: linopy | wall | peak: lpspec | peak: linopy | peak | LP |
|---|---|---|---|---|---|---|---|---|---|
| 12k | 100% | 1k | 0.01 s | 0.02 s | 0.46x | 0.19 GB | 0.24 GB | 0.79x | — |
| 120k | 100% | 10k | 0.03 s | 0.04 s | 0.80x | 0.27 GB | 0.32 GB | 0.86x | — |
| 1.2M | 100% | 100k | 0.21 s | 0.18 s | 1.21x | 0.72 GB | 0.70 GB | 1.04x | — |
| 12M | 100% | 1M | 2.17 s | 1.65 s | 1.32x | 2.46 GB | 3.03 GB | 0.81x | — |
sector — every rung, every sink
sector — gurobi sink
Both arms end holding a populated gurobipy.Model with optimize() never called: lpspec through build_gurobi, linopy through to_gurobipy(set_names=False). Opt-in — it needs the [gurobi] extra — and the same discipline as the highs sink.
| variables | live | rows | wall: lpspec | wall: linopy | wall | peak: lpspec | peak: linopy | peak | LP |
|---|---|---|---|---|---|---|---|---|---|
| 1k | 6% | 1k | 0.01 s | 0.03 s | 0.41x | 0.20 GB | 0.22 GB | 0.89x | — |
| 10k | 6% | 10k | 0.02 s | 0.05 s | 0.49x | 0.21 GB | 0.24 GB | 0.90x | — |
| 100k | 6% | 100k | 0.13 s | 0.24 s | 0.52x | 0.38 GB | 0.55 GB | 0.70x | — |
| 1M | 6% | 1M | 1.21 s | 2.25 s | 0.54x | 1.48 GB | 3.36 GB | 0.44x | — |
sector — highs sink
Both arms end holding a populated highspy.Highs with run() never called: lpspec through build_highs, linopy through to_highspy(set_names=False). The simplex is the same work whoever filled the model, so timing it would say nothing about the lane that filled it.
| variables | live | rows | wall: lpspec | wall: linopy | wall | peak: lpspec | peak: linopy | peak | LP |
|---|---|---|---|---|---|---|---|---|---|
| 1k | 6% | 1k | 0.01 s | 0.02 s | 0.39x | 0.19 GB | 0.22 GB | 0.86x | — |
| 10k | 6% | 10k | 0.01 s | 0.03 s | 0.39x | 0.20 GB | 0.23 GB | 0.86x | — |
| 100k | 6% | 100k | 0.03 s | 0.11 s | 0.27x | 0.32 GB | 0.49 GB | 0.65x | — |
| 1M | 6% | 1M | 0.23 s | 0.92 s | 0.25x | 0.95 GB | 2.85 GB | 0.33x | — |
sector — lp sink
lpspec writes the LP file, linopy through its lp-polars writer.
| variables | live | rows | wall: lpspec | wall: linopy | wall | peak: lpspec | peak: linopy | peak | LP |
|---|---|---|---|---|---|---|---|---|---|
| 1k | 6% | 1k | 0.01 s | 0.03 s | 0.41x | 0.18 GB | 0.24 GB | 0.78x | — |
| 10k | 6% | 10k | 0.01 s | 0.04 s | 0.41x | 0.20 GB | 0.26 GB | 0.77x | — |
| 100k | 6% | 100k | 0.04 s | 0.11 s | 0.38x | 0.32 GB | 0.54 GB | 0.59x | — |
| 1M | 6% | 1M | 0.32 s | 0.91 s | 0.36x | 0.92 GB | 2.91 GB | 0.32x | — |
transport — every rung, every sink
transport — gurobi sink
Both arms end holding a populated gurobipy.Model with optimize() never called: lpspec through build_gurobi, linopy through to_gurobipy(set_names=False). Opt-in — it needs the [gurobi] extra — and the same discipline as the highs sink.
| variables | live | rows | wall: lpspec | wall: linopy | wall | peak: lpspec | peak: linopy | peak | LP |
|---|---|---|---|---|---|---|---|---|---|
| 9.8k | 100% | 1.4k | 0.02 s | 0.04 s | 0.45x | 0.20 GB | 0.22 GB | 0.92x | — |
| 98k | 100% | 14k | 0.07 s | 0.10 s | 0.70x | 0.28 GB | 0.26 GB | 1.08x | — |
| 980k | 100% | 140k | 0.59 s | 0.68 s | 0.86x | 0.90 GB | 0.75 GB | 1.20x | — |
| 9.8M | 100% | 1.4M | 5.90 s | 6.56 s | 0.90x | 5.15 GB | 5.03 GB | 1.02x | — |
transport — highs sink
Both arms end holding a populated highspy.Highs with run() never called: lpspec through build_highs, linopy through to_highspy(set_names=False). The simplex is the same work whoever filled the model, so timing it would say nothing about the lane that filled it.
| variables | live | rows | wall: lpspec | wall: linopy | wall | peak: lpspec | peak: linopy | peak | LP |
|---|---|---|---|---|---|---|---|---|---|
| 9.8k | 100% | 1.4k | 0.01 s | 0.03 s | 0.38x | 0.19 GB | 0.22 GB | 0.88x | — |
| 98k | 100% | 14k | 0.02 s | 0.04 s | 0.48x | 0.24 GB | 0.23 GB | 1.02x | — |
| 980k | 100% | 140k | 0.11 s | 0.13 s | 0.81x | 0.58 GB | 0.46 GB | 1.27x | — |
| 9.8M | 100% | 1.4M | 0.93 s | 1.20 s | 0.78x | 2.88 GB | 2.66 GB | 1.08x | — |
transport — lp sink
lpspec writes the LP file, linopy through its lp-polars writer.
| variables | live | rows | wall: lpspec | wall: linopy | wall | peak: lpspec | peak: linopy | peak | LP |
|---|---|---|---|---|---|---|---|---|---|
| 9.8k | 100% | 1.4k | 0.02 s | 0.04 s | 0.39x | 0.19 GB | 0.24 GB | 0.78x | — |
| 98k | 100% | 14k | 0.03 s | 0.05 s | 0.56x | 0.25 GB | 0.31 GB | 0.81x | — |
| 980k | 100% | 140k | 0.16 s | 0.19 s | 0.85x | 0.55 GB | 0.66 GB | 0.82x | — |
| 9.8M | 100% | 1.4M | 1.57 s | 1.66 s | 0.95x | 1.90 GB | 1.77 GB | 1.07x | — |
What this says
Ahead on wall on five of six through highs and lp, and on six of six
through gurobi. Peak depends on the sink: mostly behind through highs,
mostly ahead through lp. At the l rung:
| dispatch | fleet | nodal | profiled | sector | transport | |
|---|---|---|---|---|---|---|
wall — highs |
0.60x | 0.83x | 0.47x | 1.46x | 0.25x | 0.78x |
peak — highs |
1.46x | 1.09x | 0.89x | 1.26x | 0.33x | 1.08x |
wall — lp |
0.75x | 0.98x | 0.73x | 1.32x | 0.36x | 0.95x |
peak — lp |
0.74x | 1.45x | 0.68x | 0.81x | 0.32x | 1.07x |
wall — gurobi |
0.88x | 0.91x | 0.84x | 0.89x | 0.54x | 0.90x |
peak — gurobi |
1.11x | 1.13x | 0.91x | 1.02x | 0.44x | 1.02x |
How much of this is reproducible: peak, nearly all of it; wall, the sign. Two full ladders were run back to back — the second with nine rounds per measurement instead of five, on a quieter machine — and compared cell by cell:
| median difference | worst cell | |
|---|---|---|
| peak | 0.7% | 7.7% |
| wall | 5.3% | 65% |
Peak is a property of what the code allocates and it reproduces: 1.46x is 1.46x
both times. Wall on a shared laptop is partly a property of what else was
running — dispatch through lp came out 0.46x and then 0.75x, profiled
through gurobi 1.27x and then 0.89x. So read a wall cell for its sign and
its order of magnitude, not its second digit, and treat anything within 5% of
1.00x as parity. The claims above are the ones that survived both runs.
Gurobi is the slowest destination for both arms — and the only one we lead
across the board. 5.7s against 6.5s on dispatch, where highs is 0.46s
against 0.76s. gurobipy's ingestion is a per-row and per-column cost neither
lane can route around (#434), so
it is a constant added to both; what is left showing is the build in front of
it, which is ours.
profiled is the case in the ladder we lose through highs and lp —
1.46x and 1.32x — though not through gurobi, where the solver's own ingestion
swamps the difference. A parameter dense over the whole variable product is the array xarray
already wants and a full-size join for us. It is in the set on purpose.
The LP file is where the representation pays off, which is the opposite of
what this page used to say. Ahead on peak on four of six there, including 0.75x
on dispatch and 0.31x on sector. Two go against us: fleet 1.47x and
transport 1.08x, and both are structural — COO carries a (row, col, coeff)
triple per nonzero where a dense array carries one float, and the
many-declaration shape is the one that shows it.
Sparsity is what separates the peak numbers, not size. At the same rung
sector is 0.31x of linopy's peak through the LP sink and dispatch 0.75x: a
coordinate that does not exist is an absent row here and a NaN in a dense array
there, so the gap tracks how much of the coordinate product a model uses.
Two costs, and both are real
The harness spawns one process per measurement, so every timing above is a first build, which pays whatever lazy work a lane does on its first call. That is the right number for a caller who builds one model and solves it, and the wrong one for a rolling horizon, which pays it once.
Marginal cost per model
Build only, repeated in one process. first is what a caller pays who builds one model and solves it; steady is what every model after the first costs in a rolling horizon. Every lane does lazy first-call work that a loop never pays again — ~180 ms of it on the eager lane, ~4 ms here.
| case | vars | lpspec: first | lpspec: steady | linopy: first | linopy: steady | steady vs linopy | |---|---|---|---|---|---| | transport | 9.8k | 17.1 ms | 12.6 ms | 218.0 ms | 33.8 ms | 0.37x | | dispatch | 10k | 10.3 ms | 5.9 ms | 195.6 ms | 12.8 ms | 0.46x | | profiled | 12k | 12.3 ms | 7.6 ms | 197.3 ms | 17.9 ms | 0.42x | | fleet | 12k | 35.1 ms | 29.2 ms | 265.2 ms | 87.2 ms | 0.34x | | nodal | 12k | 11.7 ms | 7.0 ms | 199.0 ms | 18.2 ms | 0.38x | | sector | 17k | 13.6 ms | 9.0 ms | 204.6 ms | 23.3 ms | 0.39x | | transport | 98k | 23.3 ms | 18.1 ms | 219.8 ms | 35.2 ms | 0.51x | | dispatch | 100k | 12.7 ms | 7.9 ms | 196.2 ms | 13.2 ms | 0.60x | | fleet | 120k | 39.3 ms | 33.6 ms | 266.1 ms | 89.5 ms | 0.37x | | nodal | 120k | 13.5 ms | 8.6 ms | 202.0 ms | 19.8 ms | 0.43x | | profiled | 120k | 22.4 ms | 17.5 ms | 200.0 ms | 19.9 ms | 0.88x | | sector | 170k | 16.0 ms | 11.3 ms | 211.2 ms | 27.4 ms | 0.41x | | transport | 980k | 78.3 ms | 67.0 ms | 242.8 ms | 57.8 ms | 1.16x | | dispatch | 1M | 29.7 ms | 22.2 ms | 198.4 ms | 19.0 ms | 1.17x | | fleet | 1.2M | 71.8 ms | 61.0 ms | 279.8 ms | 98.4 ms | 0.62x | | nodal | 1.2M | 25.5 ms | 19.3 ms | 221.2 ms | 30.2 ms | 0.64x | | profiled | 1.2M | 121.3 ms | 112.8 ms | 215.5 ms | 34.3 ms | 3.29x | | sector | 1.7M | 32.0 ms | 26.2 ms | 263.0 ms | 74.2 ms | 0.35x | | transport | 9.8M | 644.3 ms | 628.9 ms | 618.1 ms | 387.0 ms | 1.62x | | dispatch | 10M | 167.8 ms | 148.0 ms | 264.3 ms | 57.5 ms | 2.57x | | profiled | 12M | 1186.4 ms | 1134.4 ms | 379.2 ms | 161.0 ms | 7.05x | | fleet | 12M | 423.9 ms | 379.2 ms | 366.7 ms | 161.6 ms | 2.35x | | nodal | 12M | 151.7 ms | 135.0 ms | 346.6 ms | 127.9 ms | 1.06x | | sector | 17M | 200.2 ms | 181.3 ms | 782.8 ms | 479.5 ms | 0.38x |
Absurd sizes
dispatch, LP sink, six rungs spanning 12,000x — the top two are past anything
the ladder covers. Best of two, read from bench/results/scaling.jsonl,
plotted in benchmarks-scaling.html:
| variables | lpspec | linopy | wall | peak |
|---|---|---|---|---|
| 10k | 0.01 s / 0.17 GB | 0.20 s / 0.22 GB | 0.07x | 0.76x |
| 100k | 0.02 s / 0.21 GB | 0.22 s / 0.27 GB | 0.11x | 0.78x |
| 1M | 0.12 s / 0.43 GB | 0.33 s / 0.58 GB | 0.35x | 0.74x |
| 10M | 1.13 s / 1.58 GB | 1.68 s / 2.15 GB | 0.67x | 0.74x |
| 40M | 5.40 s / 5.41 GB | 6.51 s / 7.98 GB | 0.83x | 0.68x |
| 120M | 20.44 s / 9.24 GB | 37.88 s / 12.58 GB | 0.54x | 0.73x |
Nothing falls over, on either lane, at a 9.97 GB LP file. The wall ratio does not decay with size — 0.54x at 120M against 0.67x at 10M, because linopy's curve steepens above 10M and this one does not.
Peak does not run out, and this page used to say it did. An earlier version of this section read 1.07x at 120M and concluded that "whatever memory headroom this lane has over the eager one is a small-and-sparse-model property, not a scaling one". That does not survive re-measurement: peak is 0.68-0.78x across four orders of magnitude, 0.73x at the top rung.
Two things moved it and only one is us. cols became positional
(#433) and took ~20% off this
case. The rest is that the earlier reading came from a run this section itself
flagged as noisy — it recorded linopy at 38.5 s and 106.2 s for the same rung.
The old number was a conclusion drawn across the noise floor.
This is the LP sink, and it is the sink where the representation wins. It is
not evidence for the highs peak row above, which goes the other way.
The 2xl rung is still the noisiest — 9-13 GB of peak on a 26 GB machine is
where other things start to matter, and it is best-of-two rather than
best-of-three. Read the ordering, not the seconds.
The density sweep, and the claim it used to refuse
One model size (50 nodes x 12 technologies x 2000 snapshots = 1.2M coordinates),
four mask densities. The expectation was that an absent pair costs the
relational lane nothing and costs the eager lane a NaN, so the gap should widen
as density falls. One model size, through the lp sink; live is how many of
the 12 technologies each node has installed.
| case | live | variables | wall: lpspec | wall: linopy | wall | peak: lpspec | peak: linopy | peak |
|---|---|---|---|---|---|---|---|---|
| nodal | 100% | 1.2M | 0.16 s | 0.38 s | 0.41x | 0.54 GB | 0.62 GB | 0.88x |
| nodal | 50% | 600k | 0.10 s | 0.31 s | 0.32x | 0.41 GB | 0.60 GB | 0.68x |
| nodal | 25% | 300k | 0.06 s | 0.27 s | 0.23x | 0.32 GB | 0.46 GB | 0.68x |
| nodal | 8% | 100k | 0.04 s | 0.24 s | 0.16x | 0.26 GB | 0.35 GB | 0.72x |
It now does, and it did not before. Wall time falls from 0.50x to 0.17x as density drops, and peak improves at every rung — 0.91x, 0.72x, 0.72x, 0.78x. The previous run of this sweep had linopy's peak below ours at the sparsest rung, and the note here said so.
What changed is not the prediction but what a mask costs us. Assigning labels under a mask used to mean sorting the whole masked product; a mask that reads none of the leading dims now leaves a rectangle, so the labels are arithmetic and the sort is of the surviving set. That was 46-66% of the build on every masked case. The sweep was measuring our own cost of being sparse, and most of it is gone.
The remaining caveat on the memory half stands, and it is the size this sweep
is run at rather than the prediction. It holds the
coordinate product fixed at 1.2M, where a dense array over it is ~10 MB and the
interpreter and libraries dominate everything. sector runs the same 8%
sparsity at a 12M product, and there the effect is unmistakable: 0.92 GB against
2.97 GB.
So the claim needs both halves — low density and a product large enough for it
to cost anything. This sweep varies one at a size that cannot show it; sector
varies the other. Neither is sufficient alone, which is worth knowing before
quoting either.
Wall time behaves throughout: our advantage grows as the model thins, 1.0x to 1.7x, because there is less to build and our fixed cost is lower.
Sink capabilities
What each sink can ingest, measured against the shipped solvers rather than assumed. The architectural reading is in docs/design/ceiling.md; the plan is Track 3.
lp_file |
HiGHS direct | Gurobi direct | |
|---|---|---|---|
| affine rows, COO, integrality | text | native | native |
| semi-continuous | text | kSemiContinuous |
native |
| SOS1 / SOS2 | text section | no concept — HighsLp has no SOS field, no addSos |
addSOS |
| indicator | text section | no concept | addGenConstrIndicator |
| quadratic objective | text section | passHessian — but Hessian + integrality returns kError, so no MIQP |
native, incl. MIQP |
HiGHS results are measured here; Gurobi's are from the API and linopy's
SolverFeature table, and want a spike before they are relied on. linopy
declares HiGHS with INTEGER_VARIABLES and QUADRATIC_OBJECTIVE in one flat
frozenset, so its own model reports MIQP as available — the conjunction is
what a capability descriptor has to express.
The quadratic handoff
Neither direct API has an incremental counterpart to batched
addCols/addRows: passHessian and setMObjective take the quadratic part
whole. Under the aligned-only scope (variable × variable at the same
coordinates) Q is diagonal, so it costs 16 bytes per quadratic column:
| quadratic cols | diagonal Hessian |
|---|---|
| 10⁷ | 0.16 GB |
| 3.56×10⁷ | 0.57 GB |
| 10⁸ | 1.60 GB |
Against a solver_direct peak already dominated by HiGHS's own model, that is
a small fraction. On lp_file a quadratic
objective is a text section and sinks like any other. So this is a cost, not an
invariant violation. Two caveats:
- HiGHS accepts
dim_ < num_col(verified), so ordering quadratic variables first bounds the Hessian to that block rather than the whole model. - The diagonal argument dies with the aligned restriction. General bilinear
Qis not diagonal, and its cost stops tracking the model — a second, independent reason that restriction is load-bearing.
Not measured yet
This section exists so that a claim with no table under it is visible as one.
Two of its entries are load-bearing elsewhere — README.md and docs/ROADMAP.md
lead on cost, and until these land they lead on the hand-off numbers above and
nothing else.
In rough order of what would change a decision:
- The LP-file route as a cold floor. The hand-off tables compare against
linopy's best path deliberately. What they do not price is the route the
claim "there is no file" is really about: write the LP, then have a solver
read it back. The one figure in that direction is anecdotal and single-case —
dispatch/lthrough linopy'sio_api='lp'peaks at 6.92 GB against 3.38 GB direct — and it prices only the writing half, in the eager lane. - Marginal cost per model in a loop. The architectural claim is that nothing accumulates between builds, so the hundredth rolling-horizon window costs what the first did. It follows from there being no process-wide state and no lifetime to leak, and every rung here is a single build in a fresh process — which is exactly why none of them tests it.
storage— the cyclicshiftrecurrence. The one plan shape in the language whose cost is not obviously linear in the model. The case now exists —bench/models/storage.yaml, held atdispatch's width ondispatch's ladder so the two read against each other — but every number on this page predates it, so it is unmeasured here rather than unwritten.- A MILP, where solve time dwarfs build and the build ratio stops mattering.
- A hand-written highspy/CSR arm as the speed-of-light floor. Without one, every ratio here has linopy as its only denominator.
Two entries that used to be here are now measured and have moved into the file:
solver_direct end to end (the highs sink, which now runs by default) and the
mask-density sweep.
Method
Recorded in bench/README.md — one process per
measurement, ru_maxrss rather than a tracker, import excluded from
wall_seconds and teardown included, and a parity gate that aborts the run
before anything is timed if the two lanes disagree. Failures are results and are
rendered as cells.
Measurement pitfall worth keeping: memray's tracker slows an allocation-heavy engine several-fold and overcounts reserved arenas, so it can attribute memory but must never time anything. Peak RSS is the gate metric; memray is for attribution only.